GeniTutorial
Introduction
This tutorial will give an in depth lesson on using Flack to set up a customized slice. It will then show how to add GEMINI and then visualize and archive the GEMINI measurements.
Flack is a Flash based Google map client that visualizes and allows manipulation of GENI resources.

The Flack Manual describes the basic features.
The Genidesktop visualizes and gives real time updates of the slice's measurements. Here you can monitor your network's activity.

INSTOOLS Live View gives a more detailed drill down into the slices measurement data.

Pre-requisites
You must have an account setup on one of the emulab aggregates. Your browser must be Flash ready.
If you do not already have an account, guest accounts have been setup for this tutorial. Use the login information on the handouts.
The guest will have an account on emulab.net that gets you a protogeni account automatically.
You may also request an account by going to www.emulab.net and clicking on the "Request Account" button. Note that account creation in this case may require approval and may take a while.
Log into the Genidesktop
Goto https://genidesktop.netlab.uky.edu![]()
Click Login to begin.
![]()
Select your account issuer. In this example it is UK.
Wait while the certificate issuer is contacted.
![]()
If you are not currently logged into your GENI account you will get this message. Click OK to go to your account issuer so you can log on.
![]()
Log on to your account, then click Retry to return to the Genidesktop log on page.
![]()
You will be returned to the Genidesktop Log on page. Reselect your certificate issuer.
![]()
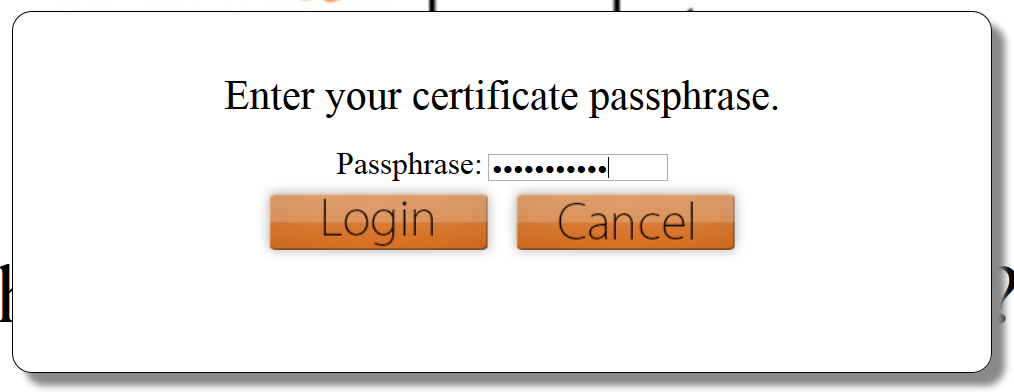
Now you should be prompted to enter you passphrase. Do so and click Login.
You are now logged on to the Genidesktop. If you already have slices created, they will be listed under the Available slices.
If you would like to create a new slice, you may do so in FLACK. Click the FLACK button to open FLACK.
![]()
Using Flack
You will select which Aggregate Managers to contact for resource information. For this tutorial, you only need to ask the Utah Emulab and Utah Genirack AMs for resources.


Flack will now retrive the current status of the GENI resources. You are now ready to create a new slice.

The Slice
When you first log into Flack, you will see the map of the Protogeni resources and a listing of your slices. Starting from this tutorial, you will have no slices.
Click the New button in the Slices area on the left:

Create a new slice by typing the name of the slice in the text box. Slice names must be unique per aggregate. An easy way to keep track of this is to use your user name as part of the slicename. For this tutorial, use the slice name given in your handout.

The Slice view will appear with the new slice name in the upper left. In this case the name is "gslice1".

Nodes can be added to the slice by dragging from the aggregate where you want to create the node.


The two most common node types are a PC (bare metal computer) and a VM (virtual machine shared with others).
To see and edit information about the node, click on the 'i' icon. This will bring up information about that node.

The node information tab lets you configure the node. We will come back to this screen.

Click "Cancel" to close the information window.

Drag another node from utahemulab.cm onto the slice window.

A line appears when you hover the mouse near a node. Create a link by dragging that line.


When you release the line over another node, a linke is created between them.

Now that you know the basics of how to edit as slice graphically, lets load the pre-configured tutorial topology.
Importing the Tutorial Rspec
First, click the eraser to clear the canvas.


Load an rpec from a given URL by clicking on the import drop down. Then click on the globe icon for "Import from the web".


Type in your rspec URL from your handout. If you don't have a handout, you can type in http://protogeni.net/tutorial.xml before clicking "OK".

Our tutorial experiment is now loaded into your client.

Click on the "i" icon to view information about the "source" node. The loaded rspec contained the custom settings for the node. It downloads and runs software which will send traffic along these links.


Use GEMINI
To use gemini tools in your slice, select the plugins tab.

Check "Use Gemini Extensions". You will notice that extra nodes are added at each manager onto the canvas, these are nodes required for Gemini.


Creating Your Slivers
Now that we have the final topology, we can create the slice.

Click yes to verify that you want this topology created.

Once the slice creation begins, the background will change color to orange.


As slivers of the slice are created, the outlines of the nodes will change color to indicate their status.

Once the slice is created, the background and borders will all be green.

If there is an error encountered while the slice is being submitted, you will get a window like:

The best thing to do is to click on the link and see what the error message is. You will most likely want to give that URL to an administrator who can debug the problem.
GENI Dekstop
The GENI Desktop allows you to visualize the slice and its measurements. Return to https://genidesktop.netlab.uky.edu .
Your list of slices should now have your newly created slice. To view a slice, click on the slice name in the list of Available Slices.

The GENI Desktop will check on the status of the slice. If needed, initialization will take place automatically. The slice page will load once the check is complete.
The GENI Desktop is where the slice is mapped out in multiple views. The default view is a logical graph view. There is also a list view and a geographic view. Use the icons under the Views menu section to show and hide the views.
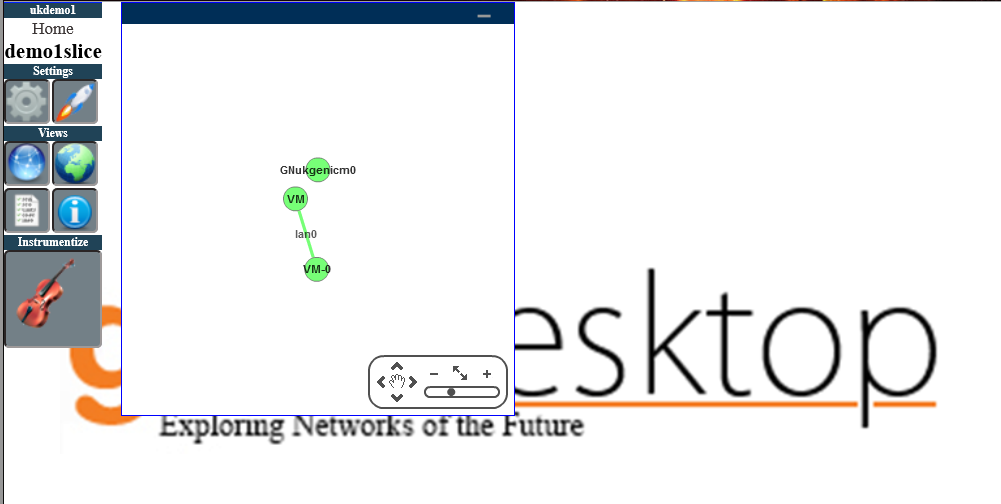
Using these views, it is possible to find and select nodes. Hovering over a node will also give you more details about the node or link in the Info view box.
To view the graphs and detailed measurement data the slice must be instrumentized. Click on the Instrumentize button to start the process.
![]()
A progress window will open to show the status of the intstrumentation process.
Once the process is completed click the button to reload the page with the instrumentized slice. You may also review the output from the instrumentation process.
![]()
Now you have full access to the measurements for the slice. Click on the launcher icon to bring up the list of modules available for the slice. To see the graphs click GEMINI Graphs.
![]()
Select the node you want examine. Check the check boxes for the types of graphs you want to see. Then click the Add Graphs button.
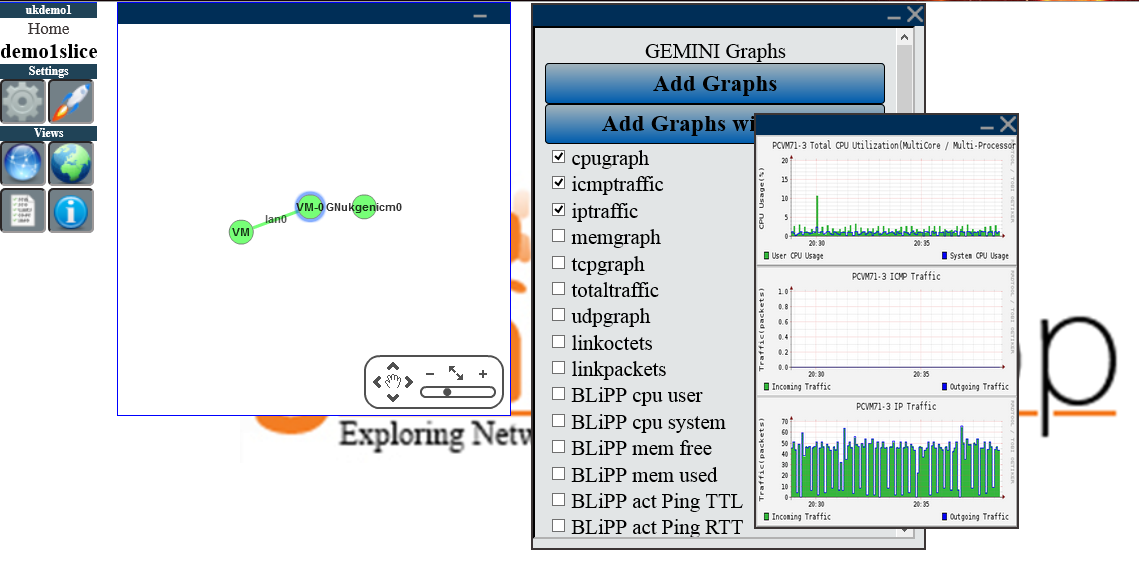
Hovering over the graphs will enlarge them. Double clicking a graph will open it in a separate window.
Omni, SSH, and Layer 2
This tutorial has covered just two of the tools used to interact with GENI. To try using the Omni tool, logging into the nodes, and sending out layer 2 traffic, you can use these same slivers in the next Tutorial.